What Google & Apple’s Mobility Data Reveals About Oz During COVID-19
Both Google and Apple have now released mobility data trends gathered from Google Maps and Apple Maps to help public health authorities and governments understand how people are travelling during the COVID-19 pandemic.
Google’s data charts movement trends for different categories of places, such as retail and workplaces, taking into account the number of visits and the length of stay at different places.
As of the 05.04.2020 Google mobility report, Australians had spent 44% less time at retail and recreation spots – which includes places like restaurants, cafes, shopping centres, libraries and cinemas – compared to the baseline (the baseline refers to the median value of the corresponding days of the week during the five-week period from 3rd January – 6th February 2020).

Source: Google
Interestingly, the grocery and pharmacy fell by 18% across Australia, despite the panic-buying that has swept Australia’s major supermarket chains. This could be reflective of the recent easing of grocery panic-buying, or it could simply be that Australians are making fewer shopping trips but are buying more when they do go.

Source: Google
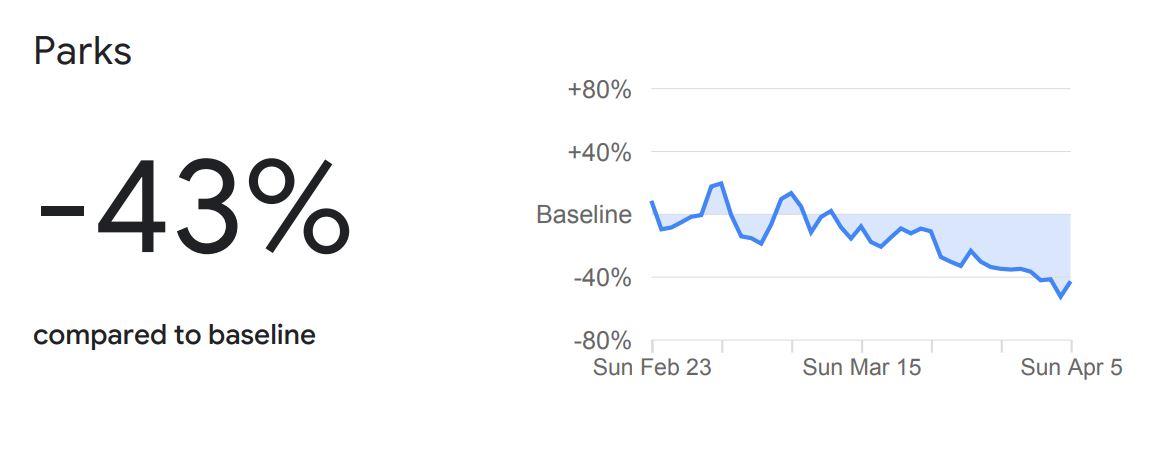
Travel to transit stations was down 62%, as was parks (-43%) and workplaces (-36%). Residential was the only location category that rose, marking an increase of 14% against the baseline.
Source: Google
In terms of break down by state, there was the most variance in the parks category. While there were significant declines in Tasmania (-76%), Victoria (-75%), South Australia (-48%) and Western Australia (-43%), there were more moderate declines in Queensland (-35%), New South Wales (-27%), the Northern Territory (-22%) and the ACT (-7%).
Source: Google
Google has said that they will release regular updates on mobility trends “so long as public health officials find them useful in their work to stop the spread of COVID-19”.
Apple’s data is more geared towards the types of location requests that are made on Apple Maps, i.e., for walking, driving, or transit. It does not take into account where users actually went.
According to Apple, travel requests in Australia fell across all modes of transport: driving was down 44%, walking fell by 53% and transit declined by 78%. Apple does not have a breakdown by state but does have data for Sydney and Melbourne specifically.

Source: Apple
Both companies have stated that they have data privacy protections in place, and that no information is personally identifiable.